

Most of my options research used to follow the same slightly awkward route.
I would find an interesting stock in TC2000, study the daily, weekly and monthly charts, check whether the move was extended, and mark the levels that mattered. Then I would open other resources to review expiration dates, expected move, implied volatility, earnings, and the option chain. If a possible structure began to make sense, I would move to OptionStrat and start testing strikes.
This workflow gave me plenty of information, but it left one important decision entirely manual.
I could explain why the underlying was interesting. I could also build almost any options structure once I had chosen it. The difficult part was deciding which structure deserved attention in the first place.
A strong chart does not answer that question. Neither does an option chain. Even a good payoff calculator expects me to arrive with a strategy already in mind.
Over time, I realized that this gap was taking up more of my research than the actual construction of the trade. I was repeatedly combining the same pieces of information and trying to decide whether the current setup called for a credit spread, a debit spread, a butterfly, a condor, a ratio structure, or something else.
That is the problem I built Options Playbook to solve.

Strategy Selection Comes Before Trade Construction
Many options tools are designed around a strategy-first workflow.
You select a call spread, a butterfly, an iron condor, or another structure. Then you choose the underlying, expiration, and strikes before adjusting the position.
That is useful once the strategy has already been selected.
My own research usually begins from the opposite direction. I first find an underlying that deserves attention. I then need to understand what the chart, expiration, volatility, expected move, earnings calendar, and option chain collectively suggest.
Only after that do I want to choose the structure.
This distinction may sound small, but it changes the entire workflow.
Suppose AAPL is in an established daily uptrend, but the recent advance has already pushed momentum into moderately extended territory. Earnings are approaching, and the options market is pricing an expected move around the event.

Several strategies may appear reasonable in this situation, but each one expresses a different assumption. A Bear Call Spread and a Call Broken Wing Butterfly can both express caution after an extended move, but they behave differently if momentum continues. A Long Put Spread may benefit from a direct reversal, while a premium-selling structure may only need the stock to stop advancing. A long volatility position may appear attractive before earnings, but it still has to overcome the movement already priced into the options.
The selected expiration changes this comparison further. A position that ends before earnings represents a different trade from one that carries the announcement. Calling the setup simply “bullish,” “bearish,” or “neutral” does not provide enough information to choose the structure.
The stock idea is only the beginning. Choosing an options strategy requires a more precise description of what I expect to happen and how I want the position to respond if I am early, partially right, or completely wrong.
Five Questions Before Choosing the Structure
The decision becomes more manageable when the setup is reduced to five practical questions.
🤔 What is the underlying doing?
The daily chart describes the current move, while the weekly chart shows whether it agrees with the broader trend. A short-term rally inside a weak weekly structure is a different setup from a rally supported by both timeframes.
🤔 How extended is the move?
Direction alone is not enough. RSI, momentum, and the recent price path help distinguish a move that may still have room from one that is already stretched and more vulnerable to a pause or reversal.
🤔 What happens before expiration?
The amount of time remaining and whether earnings fall before or after the selected expiration can completely change the trade. A structure that makes sense before an event may be a poor fit when it has to carry the event risk.
🤔 What is the options market pricing?
Expected move, implied volatility relative to realized movement, put-call skew, and liquidity show how expensive the available exposure is and whether the option chain supports the intended structure.
🤔 What does the payoff need to accomplish?
The position may need continued direction, a limited move, time decay, volatility expansion, mean reversion, or protection against a tail event. “Bullish” and “bearish” are not precise enough to answer this question.
These five questions are connected, but one input can change several of the answers at once: the expiration date.
Expiration Changes More Than Time
An expiration date is often treated as something selected after the strategy. In practice, it influences which strategies deserve consideration in the first place.
Take the same AAPL setup shown above and select a near-term expiration.
Options Playbook builds the analysis from the contracts available for that exact date. The daily chart receives more decision weight, the time remaining becomes part of the strategy filter, and the system checks whether earnings fall before or after expiration. Expected move, implied volatility, skew, liquidity, and available strikes are all calculated from that specific option surface.

Now select a later expiration.
The underlying and its current chart have not changed, but the options trade has. The expected move covers a longer period, the volatility surface is different, earnings may now sit inside the trade, and the weekly chart becomes more important. Some strategies become more natural for the new horizon, while others are deprioritized or removed from consideration.

Options Playbook does not take the first result and stretch it across the calendar. Each ticker + expiration combination produces a separate analysis.
That is why the two AAPL screens can show different rankings without contradicting each other. They are answering different questions.
What Options Playbook Calculates
Selecting an expiration starts a new preparation process rather than a simple DTE adjustment. The analysis is organized around five groups of evidence.
Market structure
The product reads up to 120 completed daily bars and up to 100 weekly bars. It evaluates trend, momentum, RSI extension, the recent price path, and any prepared technical signals. Shorter expirations place more weight on daily structure, while longer horizons gradually shift the main thesis toward the weekly chart.
Time and event fit
The selected expiration is assigned to a time horizon, and every strategy has its own policy for that horizon. Earnings timing is evaluated separately, so an event occurring before expiration becomes part of the analysis rather than a generic warning attached to every result.
Volatility pricing
Options Playbook calculates the expected move for the selected expiration, at-the-money implied volatility, recent realized volatility, and the relationship between them. It also measures the difference between put and call volatility around the 25-delta area to understand how directional risk is being priced.
Option-chain quality
The system checks quote coverage, bid/ask spreads, open interest, daily volume, available strikes, and whether implied volatility and Greeks can be calculated across enough of the chain. A theoretically attractive strategy should not rank well if the required contracts are impractical or the market data is incomplete.
Payoff precision
The final question is not simply whether a strategy is bullish, bearish, or neutral. The system compares the actual payoff logic: bounded direction, premium income, target zone, range, convex movement, mean reversion, protection, or another form of exposure. It also compares each selected strategy with its nearest alternative to determine which one expresses the prepared setup more precisely.
👉 Once these five evidence groups are prepared, a high-capability AI model performs the final comparison. It is not given an open-ended request to suggest “the best strategy.” It receives the calculated facts for one ticker and expiration, a fixed strategy catalog, and a strict scoring contract. The model must evaluate all 38 strategies, support every part of the Fit score with available evidence, and return exactly five results.
I deliberately chose a top-tier model for this stage rather than a cheaper lightweight model. That makes each analysis more expensive to run, but this is the part of the product where small differences in timing, volatility, and payoff structure need to be understood correctly.
The output is validated before it reaches the screen. If the model selects an unavailable strategy, cites unsupported evidence, or breaks the required response contract, the result is rejected rather than shown as a confident answer. This keeps the AI useful for interpretation without allowing it to wander beyond the market data and strategy rules built into Options Playbook.
From 38 Strategies to the Top Five
The final result contains five strategies ranked by their fit with the selected market setup and expiration.
Each Fit score is built from the five evidence groups described above, allowing the final ranking to reflect more than a simple directional opinion.
The score is not a probability of profit and should not be read as one. It is a comparative measure that shows why one structure fits the prepared conditions better than another.
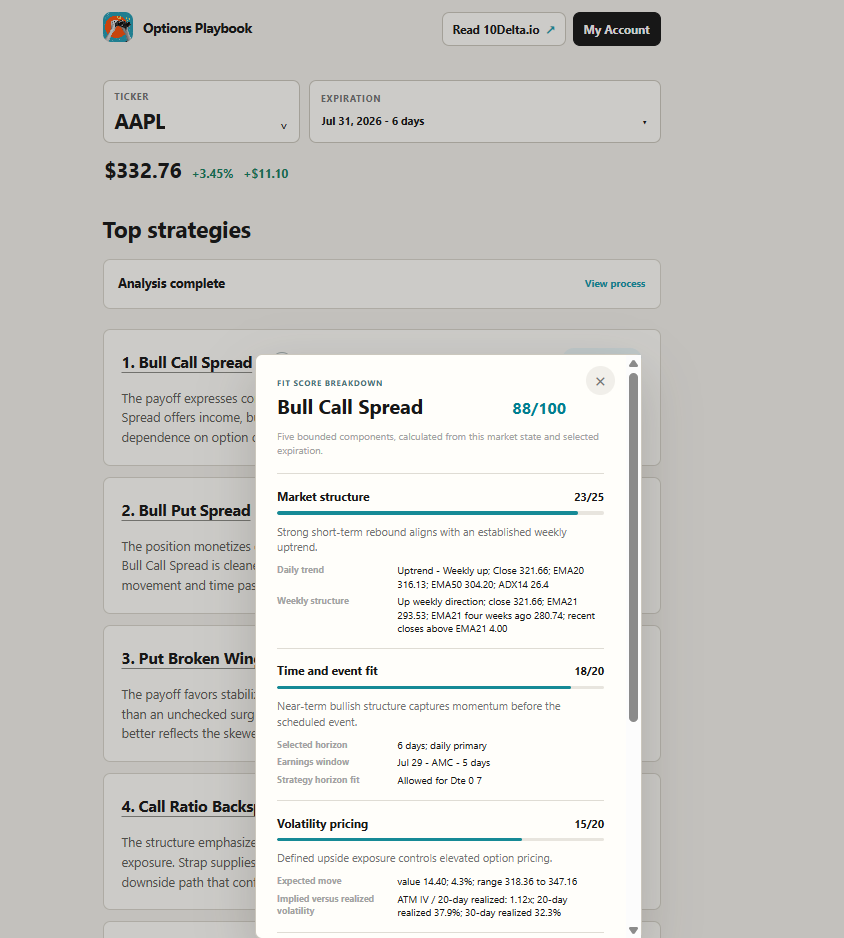
Each strategy includes two short explanations. The first describes the market bet expressed by the payoff. The second explains why that payoff is more suitable than a nearby alternative.
The Fit panel opens the evidence behind the score, including the market, timing, volatility, and chain facts used for that particular result. This makes it possible to see whether a strategy ranked well because of the trend, the expected move, relative volatility pricing, event timing, liquidity, or the shape of its payoff.
The strategy name then opens the corresponding structure in OptionStrat, where the position can be inspected and adjusted further.
Where Options Playbook Fits in the Workflow
Options Playbook does not replace TC2000, TradingView, or another charting platform. Those tools remain better suited to scanning the market and doing detailed technical work.
It also does not replace OptionStrat. Once a strategy has been selected, OptionStrat remains a useful environment for adjusting strikes and studying the payoff.
Options Playbook fills the space between them.
The charting platform helps identify the underlying. Options Playbook compares the structures that fit the underlying’s current market context and selected expiration. OptionStrat then provides the next layer of position modeling.
That missing handoff was the reason the product was built.
When I first wrote about the idea in June, its working name was Options Decision OS. The planned strategy universe was smaller, and much of the product still existed as a scoring concept rather than a complete workflow. The public product is now called Options Playbook, and its first complete version is live at options.10delta.io.
You can select an underlying, review its daily and weekly context, choose any available expiration, and see how the strategy ranking changes.
Market context is available before analysis. A free account includes three complete strategy analyses, with one new complimentary analysis available per market day. Membership provides ongoing access across the available tickers and expirations.
This article introduces the complete workflow, but each part deserves a closer look. Future posts will cover expiration selection, expected move, implied versus realized volatility, options skew, liquidity, earnings, and the reasons two expirations on the same underlying can lead to very different strategies.
The objective is not to remove judgment from options trading. It is to make the first strategy decision more structured and easier to examine.
Always yours,
— Mansur
Disclaimer
All content is for informational purposes only and does not constitute financial advice. Any trades or strategies should be tested in a simulated environment before use. Trading involves risk, and all decisions are the sole responsibility of the reader.