


Evening Star is one of three key candlestick reversal patterns I track every day on the daily chart using TC2000.
The other two are Bearish Engulfing and Dark Cloud Cover — each with a dedicated post explaining how I use them.
These three patterns help me identify exhaustion points — potential short-term tops — where the market may be due for a pullback. That’s where I deploy Bear Call Credit Spreads, always with a 10-delta short leg and a defined risk.
What It Looks Like
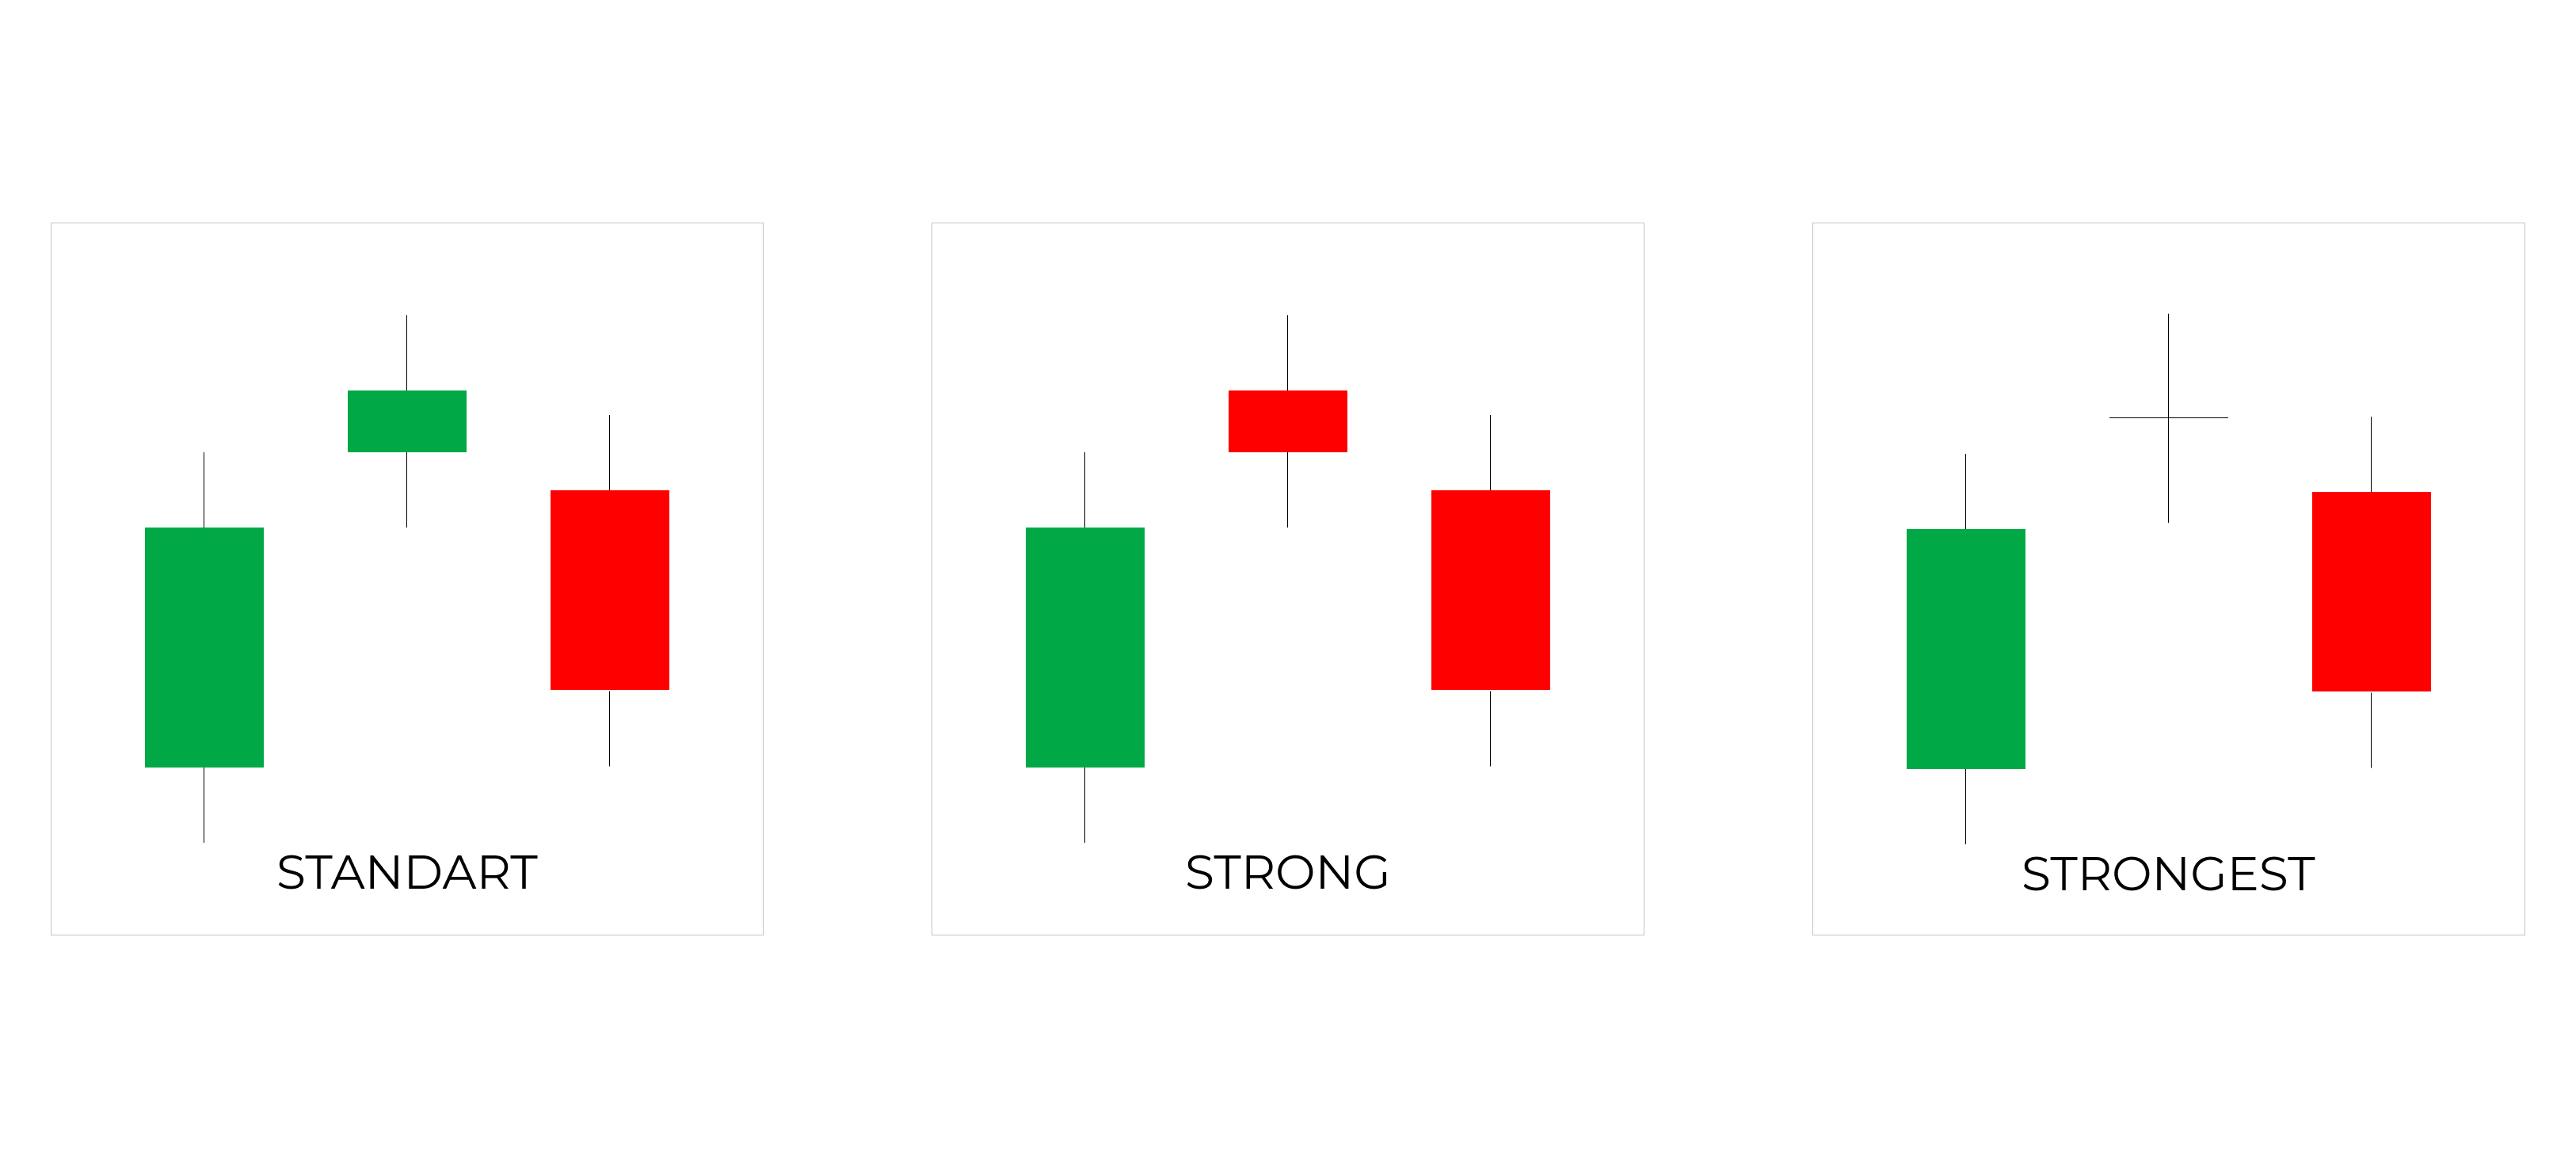
This pattern has three candles:
The first is a long bullish candle (green) — strong upward continuation
The second is a small-bodied candle, often with a gap up — it can be green, red, or a doji
The third is a bearish candle (red), which closes deep into the body of the first
The pattern is strongest when:
The second candle closes near the highs, forming hesitation
The third candle closes below the midpoint of the first
The second candle is a doji — showing max indecision
What It Signals
The Evening Star tells a story of transition.
Day 1: bulls are in full control — price pushes higher confidently.
Day 2: hesitation — the market gaps up, but doesn’t follow through.
Day 3: sellers step in and reverse the momentum.
It’s a shift from strength → indecision → weakness.
A classic topping formation.
Common reasons this shows up:
Buyers are exhausted, no new demand
Resistance is respected
Sellers act on a catalyst or news
Profit-taking intensifies
The most reliable Evening Stars appear after a sharp move up — they don’t top from a flat base.
Ideal Conditions
To give this pattern real weight, I look for setups where momentum is stretched.
Ideal conditions:
A sustained uptrend for at least 15 days, or a strong upside impulse
RSI > 75 (overbought), 65+ acceptable on strong moves
Price is near a recent or absolute high
Candle 1 is large and bullish
Candle 2 is small-bodied, ideally a doji, and doesn’t exceed candle 1
Candle 3 is bearish and closes deep into candle 1
No strong catalysts (like earnings or positive guidance)
Volume Confirmation
Volume provides valuable context:
Candle 1: strong volume is expected (buying climax)
Candle 2: low or fading volume (hesitation)
Candle 3: above average — confirms that sellers are in control
The pattern is especially strong when candle 3’s volume exceeds that of candle 1.
TC2000: How I Scan for It
In TC2000, I use a dedicated scanner for Evening Star setups, filtering only liquid, optionable, large-cap stocks.
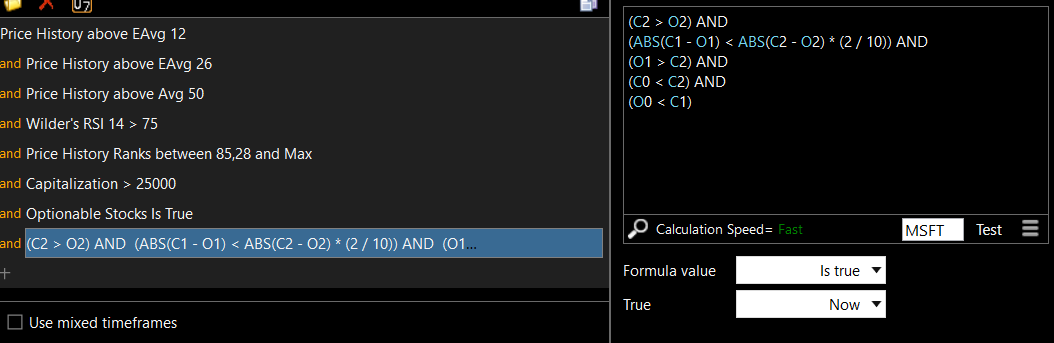
The filters include:
Price has closed above EMA12, EMA26, and SMA50 for 15 days in a row
RSI is elevated (above 75 preferred)
The stock ranks in the top 15% of its range (strong upward move)
Market cap > $25B
Optionable = true
And for the pattern itself:
Candle 1 is a bullish candle
Candle 2 is small-bodied and closes near the high
Candle 3 is a bearish candle that closes below the midpoint of candle 1
Bonus: volume on candle 3 is elevated
These filters help isolate only the cleanest, most actionable Evening Star setups.
Disclaimer
All content is for informational purposes only and does not constitute financial advice.Any trades or strategies should be tested in a simulated environment before use.Trading involves risk, and all decisions are the sole responsibility of the reader.