


Dark Cloud Cover is one of three key candlestick reversal patterns I track every day on the daily chart using TC2000.
The other two are Bearish Engulfing and Evening Star — each with a dedicated post explaining how I use them.
These three patterns help me identify exhaustion points — potential short-term tops — where the market may be due for a pullback. That’s where I deploy Bear Call Credit Spreads, always with a 10-delta short leg and a defined risk.
What It Looks Like
This pattern has two candles:
The first is a long bullish candle (green), showing strong upside momentum
The second opens with a gap up, but then closes below the midpoint of the first candle
Importantly, the second candle does not fully engulf the first one (unlike Bearish Engulfing)

What It Signals
The story behind this pattern is about bullish momentum failing.
The market opens higher (gap up) — bulls are excited
But instead of continuing upward, sellers immediately step in
The candle closes deep into the prior bullish bar
This rejection often leads to a reversal or at least a pause.
The bulls have lost control — and that’s the moment the bears get active.
It’s especially effective when:
The gap up triggers breakout buyers
But the close shakes them out entirely
The result?
A sentiment shift. From overconfidence → doubt → potential selloff.
Ideal Conditions
To increase the reliability of this pattern, I look for stretched setups in strong uptrends.
Ideal conditions:
Price has closed above EMA12, EMA26, and SMA50 for 15 days in a row
RSI > 75 (overbought)
Price is at or near recent or absolute highs
There is a gap up between the two candles
The red candle closes below the midpoint of the green candle
No major positive catalysts (like earnings or guidance)
These factors increase the likelihood that the reversal is real — not noise.
Volume Confirmation
Volume can make or break this setup.
Green candle: may come with high volume (final surge of buying)
Red candle: ideally has normal to elevated volume
If volume increases on the red candle, that adds conviction:
sellers are not just present — they’re active.
TC2000: How I Scan for It
In TC2000, I use a custom scanner to isolate these setups on large-cap, optionable stocks with clear technical structure.
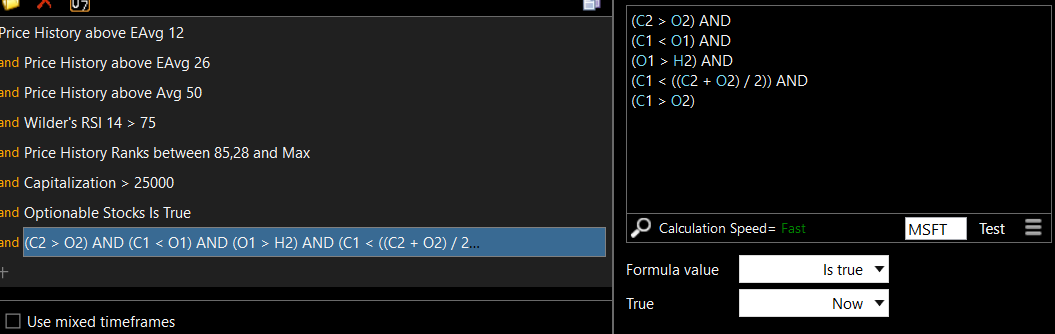
The filters include:
Price has closed above EMA12, EMA26, and SMA50 for 15 consecutive days
RSI is elevated (above 75 preferred)
The stock is in the top 15% of its range for the lookback period
Market cap > $25B
Optionable = true
And for the pattern itself:
Day 1: bullish candle
Day 2: bearish candle
The second candle opens above the high of the first (gap up)
The second candle closes below the midpoint of the first
The bearish candle does not fully engulf the first one
These conditions help isolate real signals from noise — and create reliable entries for credit spreads.
Disclaimer
All content is for informational purposes only and does not constitute financial advice.Any trades or strategies should be tested in a simulated environment before use.Trading involves risk, and all decisions are the sole responsibility of the reader.