


Bearish Engulfing is one of three key candlestick reversal patterns I track every day on the daily chart using TC2000.
The other two are Evening Star and Dark Cloud Cover — each with a dedicated post explaining how I use them.
These three patterns help me identify exhaustion points — potential short-term tops — where the market may be due for a pullback. That’s where I deploy Bear Call Credit Spreads, always with a 10-delta short leg and a defined risk.
What It Looks Like
This pattern has two candles:
The first is bullish (green), closing higher than it opened.
The second is bearish (red), and it completely engulfs the body of the first candle.
Wicks can extend beyond, but the key is:
the second candle must close below the open of the first — that’s what makes it a true engulfing.

What It Signals
The psychology is straightforward.
Day 1: buyers are in control, price climbs, confidence is high.
Day 2: that confidence vanishes — sellers come in force and erase all the prior day’s gains.
This sudden reversal suggests a sharp shift in sentiment.
It often happens because:
Big players are taking profits,
A catalyst or news changes the outlook,
Everyone who wanted to buy already did — and demand dries up.
It’s a classic exhaustion move. Bears take over.
Ideal Conditions
To give this pattern real meaning, I only act on it when there’s clear overextension to the upside.
Ideal conditions:
At least 15 strong green days in a row, or a sharp vertical move up
RSI > 75 (overbought)
A fresh local or even absolute high
Bonus points if it happens near a major resistance level
This is where the odds tilt in favor of a pullback.
Volume Confirmation
Volume on the second (bearish) candle matters.
If it’s above average — and ideally higher than the volume on the bullish candle — that adds serious weight to the signal.
It tells me that real selling pressure has entered the tape — not just random drift.
TC2000: How I Scan for It
In TC2000, I use a custom scanner to surface these setups only on liquid, optionable stocks.
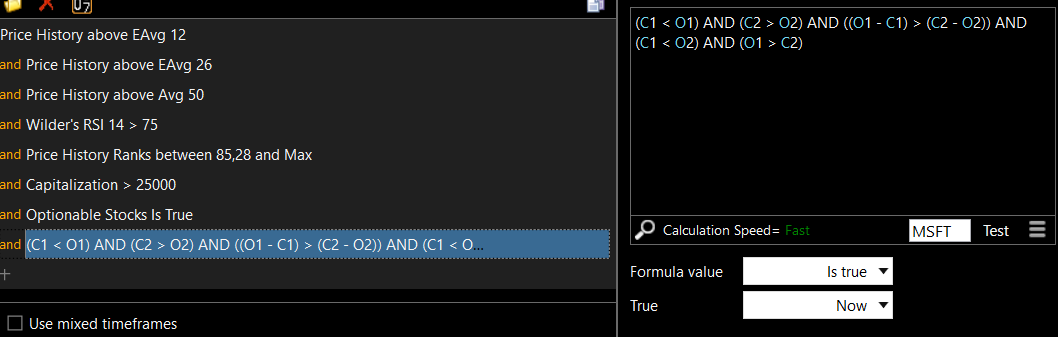
The filters include:
Price has closed above key moving averages (EMA12, EMA26,SMA50) for 15 days in a row
RSI is elevated (above 75)
The stock is in the top 15% of its range for the lookback period
Market cap > $25B
Optionable = true
And for the pattern itself:
The prior day was a bullish candle
The current day is a bearish candle that fully engulfs the previous body
The body of the bearish candle is larger than the previous day’s
Close of the bearish candle is below the open of the bullish one
Bonus: a gap-up at the open adds strength
These filters help cut through the noise and focus only on high-conviction signals.
Disclaimer
All content is for informational purposes only and does not constitute financial advice.Any trades or strategies should be tested in a simulated environment before use.Trading involves risk, and all decisions are the sole responsibility of the reader.